Streamline AWS Lambda Monitoring with Dashbird

Hi 🙋♂️, I am Aditya. I am full-stack developer from Mumbai. I am a graduate in Software Engineering from Arizona State University. I write about niche technical topics after extensively researching about them so that you don't have to! I breakdown & reverse-engineer complex architecture and workflows so that indie developers could make an informed decision about using them. I also run u/redditspeedbot on Reddit.
Are you tired of navigating through multiple AWS services to monitor your serverless applications? Do you wish there was a simpler way to get an overview of your Lambda functions without digging through Cloudwatch? Look no further than Dashbird, an agentless observability service designed specifically for serverless applications like AWS Lambda. With its consolidated dashboard, error tracking, and architecture insights, Dashbird makes it easy to monitor and manage your AWS environment. In this article, we'll take a closer look at Dashbird's features and show you how to integrate it into your workflow.
What is Dashbird?
Dashbird is an agentless observability service for serverless applications such as AWS Lambda. It also comes built-in with error tracking and architecture insights for better management of resources.
Wait, what does agentless mean? It means there is no service, process or daemon running on the machine for which the operation is being performed (in this case, for monitoring). So how does it collect data? By reading metrics, logs, and traces from Cloudwatch & AWS X-Ray. Dashbird is designed to organize and present data collected from AWS in a more readable and analyzable format.
Why Dashbird?
When I started my hunt for monitoring tools, I had the following requirements:
Individual and Cumulative Metric Analysis of my Lambda functions
Error Detection & Issue Tracking
Email Alerts
No core code change must be required
Service should have a decent free tier.
Dashbird checked all of the above boxes.
How to Integrate Dashbird?
Integrating Dashbird is a fairly simple process.
Sign up for a Dashbird account on their website.
Once you have signed up, you will be prompted to connect your AWS account to Dashbird. Follow the instructions to provide Dashbird with read-only access to your AWS services.
Dashbird will then create a CloudFormation stack in your AWS account to collect data from your Lambda functions and other AWS services.
Once the stack has been created, you can start monitoring your Lambda functions and other AWS services using Dashbird's consolidated dashboard.
That's it! Dashbird will now have read access to all of your AWS services
Features
Now that you have integrated Dashbird for your AWS services, you need to understand the features it provides. Let me list down how Dashbird can help developers identify and solve issues.
📈 Consolidated Dashboard
Dashbird's consolidated dashboard provides an overview of all your AWS services, making it easy to identify issues across your entire infrastructure.

Dashbird loads up its default consolidated dashboard as soon as you integrate your AWS account. This dashboard gives you a rundown of all your services including Lambda, API Gateway, ECS, SNS, DynamoDB, and Kinesis.
As you can see, I have mostly statistics about AWS Lambda functions since that is what I have activated it for. You can manage this setting in Dashbird preferences easily. These statistics also have their pages accessible from the left panel which I'll explain now.
🍱 Inventory
Dashbird's inventory tab gives you a way to access details of your individual services.

In the below image, you can see the statistics of my AWS Lambda Function.

In the above image, I selected my Lambda function and I can see important statistics like:
Invocations
Errors
Cold Starts
Average Duration (With Min-max, explained below)
Average Memory Consumed (With Min-max)
Average Concurrency of Functions
Cost Incurred
Time-distributed Graph of Invocations and Errors
Log of each Invocation
Grouped Error-types including Stack Trace of each event
Insights of my Function (More on it below!)
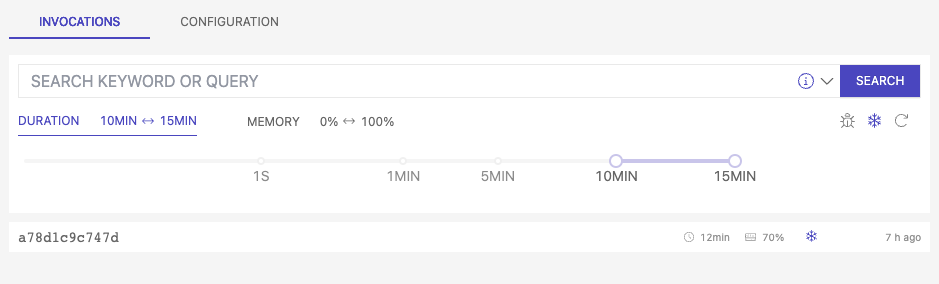
Min-max for Duration & Memory

As you can see above, for a particular period, you can track the minimum & maximum duration that invocations took. This means that some invocations took as low as 783 milliseconds but some invocations reached the 15-minute hard limit as well. You can browse which invocations reached the hard limit individually in the logs section.
Period of Events
Not only this, you can change the period of events you want to see using either Relative or Absolute periods like this.


Logs
I can see the logs of each invocation or error as follows.

I can search for particular keywords so that I can only see those events.

You can filter based on parameters like duration, memory, errors, & cold-starts like below I have done for high duration cold start invocations.
⚔️ Error Management
Dashbird's error tracking feature allows you to quickly identify and troubleshoot errors in your Lambda functions. You can see the general statistics for all the errors that occurred in a period below including the severity and the resources upon which they occurred.

But you can also filter by a particular error and you can see all logs relevant to that error.

Dashbird also comes with Issue Tracking. Once you have resolved any issues, you can mark them as resolved in the left panel so that older events are hidden and any new errors are again visible. Or if you think the issue doesn't need attention, you can mute them instead.

🔔 Alarms
You can set up alarms for which Dashbird can send you email alerts. For example, I have set an alarm for when my function invokes more than 10 times in 15 minutes.

📨 Email Alerts
Dashbird also sends email alerts for every critical error that occurs in Lambda functions and other AWS services as well.

And then again an alert when the issue is resolved for that function.
🎨 Personalized Dashboards
You can create and arrange your own widgets with only the information you need and place it on a personalized dashboard.

🔍️ Insights
Dashbird's architecture insights feature provides a visual representation of your Lambda function's architecture, making it easy to identify potential performance bottlenecks. For this, Dashbird implements a set of rules and checks continuously to check for ways to manage and improve your infrastructure. It currently has 133 such checks that include but are not limited to topics like:

You can make use of such checks to manage your infrastructure better. I feel these are amazing and help me a lot to make sure everything is up-to-date.
The Competition
In terms of how Dashbird compares to other monitoring tools, here are some key differences:
Dashbird is specifically designed for serverless applications like AWS Lambda, whereas other monitoring tools may be more general-purpose.
Dashbird is agentless, meaning that it does not require any additional software to be installed on your servers or Lambda functions.
Dashbird provides a consolidated dashboard that displays data from multiple AWS services, making it easier to monitor your entire infrastructure in one place.
Conclusion
Dashbird is an agentless observability service designed for serverless applications like AWS Lambda. It offers a consolidated dashboard, error tracking, issue tracking, alarms, email alerts, personalized dashboards, and architecture insights. Dashbird is easy to integrate and specifically designed for serverless applications, making it a powerful tool for developers to monitor and manage their AWS environment.
Credits
- Cover Image by Medium.


